Basic Dipole Calculation, Tracing and Plotting
This example demonstrates most of the functionality of outflowpy for a basic dipole solution using the default outflow profile.
import outflowpy
import numpy as np
import astropy.constants as const
import matplotlib.pyplot as plt
import matplotlib.patches as patches
from astropy.time import Time
import sunpy.map
#Model resolution
ns = 90
nphi = 180
nrho = 60
#Source-surface height (in solar radii)
rss = 2.5
#Analytic lower boundary condition
phi = np.linspace(0, 2 * np.pi, nphi)
s = np.linspace(-1, 1, ns)
s, phi = np.meshgrid(s, phi)
def dipole_Br(r, s):
return s**7
br = dipole_Br(1, s)
#Create sunpy headers for this analytic data (when downloading real data this is more meaningful)
header = outflowpy.utils.carr_cea_wcs_header(Time('2020-1-1'), br.shape)
input_map = sunpy.map.Map((br.T, header))
#Default outflow field initial condition (using an optimised solar wind flow)
outflow_in = outflowpy.Input(input_map, nrho, rss)
#Compute the field (this uses the Fortran module)
outflow_out = outflowpy.outflow(outflow_in)
#Find field line seeds (in the plane of view) and trace the field lines (using the Fortran 'FastTracer' in native spherical coordinates)
seeds = outflowpy.utils.equal_seed_sampler(outflow_out, 100, 1.5)
tracer = outflowpy.tracing.FastTracer()
field_lines = tracer.trace(seeds, outflow_out, save_flag = True)
#Make a figure of these field lines
fig = plt.figure(figsize = (5.0, 5.0))
transformed_lines = []
for fi, fline in enumerate(field_lines):
coords = fline.coords
coords.representation_type = 'cartesian'
line = np.zeros((2, len(coords)))
line[0,:] = coords.y/const.R_sun; line[1,:] = coords.z/const.R_sun
transformed_lines.append([line[0,:], line[1,:]])
plt.gca().plot(line[0,:], line[1,:], c = 'blue', linewidth = 0.5, zorder = 0)
circle = patches.Circle(
(0.0, 0.0),
1.0,
facecolor="#fc9e23",
edgecolor="black",
linewidth=1
)
plt.gca().add_patch(circle)
plt.gca().axis('equal')
plt.gca().set_xticks([])
plt.gca().set_yticks([])
plt.gca().set_axis_off()
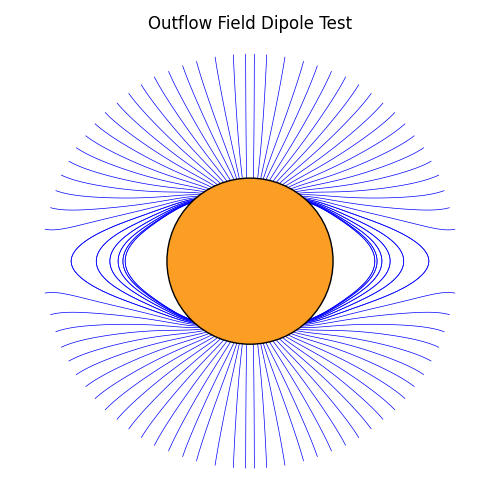
plt.gca().set_title("Outflow Field Dipole Test")
plt.tight_layout()
plt.show()
Expected output: