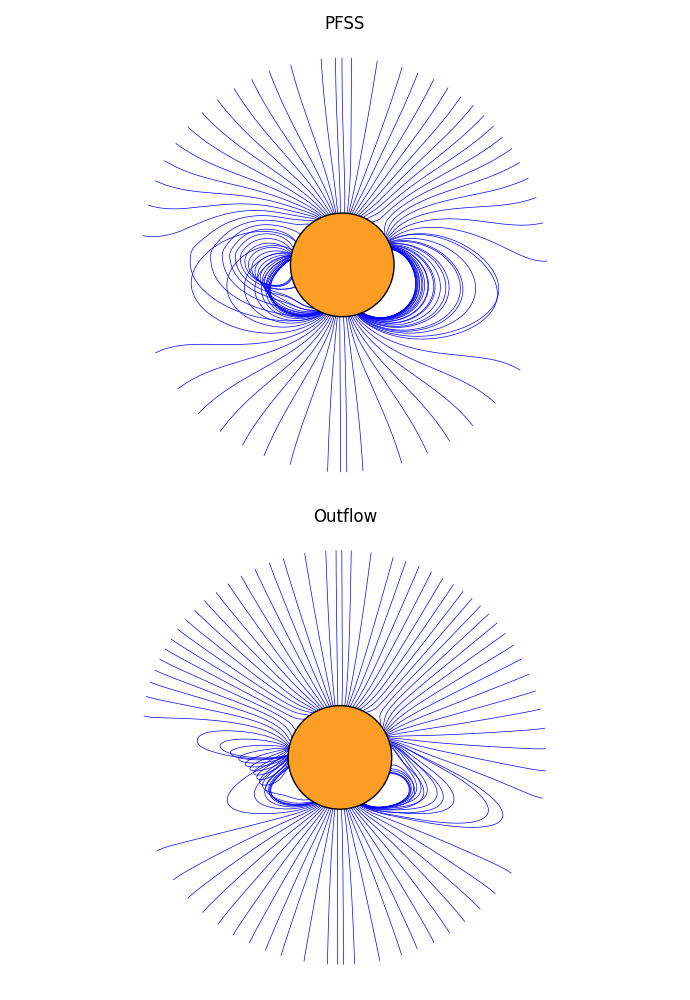
PFSS and Outflow Field Line Comparison
This script calculates PFSS and Outflow fields, traces field lines and plots them to show the difference in field line/streamer shapes.
import outflowpy

import numpy as np
import random
import matplotlib.pyplot as plt
import astropy.constants as const
import matplotlib.patches as patches

#Specify model resolutions
ns = 90
nphi = 180
nrho = 60
rss = 4.0

#Download data for a specific date and time
obs_time = "2017-08-21T00:00:00"
hmi_map = outflowpy.obtain_data.prepare_hmi_mdi_time(obs_time, ns, nphi, smooth = 1.0*5e-2/nphi, use_cached = True)

#Set up Input files for PFSS and default outflow profile
pfss_in = outflowpy.Input(hmi_map, nrho, rss, mf_constant = 0.0)
outflow_in = outflowpy.Input(hmi_map, nrho, rss)

#Calculate the magnetic fields
pfss_out = outflowpy.outflow(pfss_in)
outflow_out = outflowpy.outflow(outflow_in)

#Calculate field line seeds
#Alternatives are commented out -- either constrained to one plane, distributed based on Thomson Scattering, or completely random

seeds = outflowpy.utils.equal_seed_sampler(outflow_out, 100, 1.5) #Constrained to one plane
#seeds = outflowpy.utils.plane_seed_sampler(outflow_out, 250, 1.5, rss = 2.5) #Seeds distributed according to Thomson Scattering
#seeds = outflowpy.utils.random_seed_sampler(outflow_out, 250, 1.5, rss = 2.5) #Seeds distributed randomly in all three dimensions

#Set up FastTracer -- the Fortran tracer in the correct geometry
tracer = outflowpy.tracing.FastTracer()

field_lines_pfss = tracer.trace(seeds, pfss_out, save_flag = True)
field_lines_outflow = tracer.trace(seeds, outflow_out, save_flag = True)

#Define field line plotter function
def plot_fieldlines(ax, field_lines, title):
    transformed_lines = []

    for fi, fline in enumerate(field_lines):
        coords = fline.coords
        coords.representation_type = 'cartesian'
        line = np.zeros((2, len(coords)))
        line[0,:] = coords.y/const.R_sun; line[1,:] = coords.z/const.R_sun
        transformed_lines.append([line[0,:], line[1,:]])

        ax.plot(line[0,:], line[1,:], c = 'blue', linewidth = 0.5, zorder = 0)

    circle = patches.Circle(
        (0.0, 0.0),
        1.0,
        facecolor="#fc9e23",
        edgecolor="black",
        linewidth=1
    )

    ax.add_patch(circle)
    ax.axis('equal')
    ax.set_xticks([])
    ax.set_yticks([])
    ax.set_axis_off()

    ax.set_title(title)

    return

fig, axs = plt.subplots(2,1, figsize = (6.9, 10.0))

ax = axs[0]
plot_fieldlines(ax, field_lines_pfss, 'PFSS')
ax = axs[1]
plot_fieldlines(ax, field_lines_outflow, 'Outflow')

plt.tight_layout()
plt.show()
Expected output: