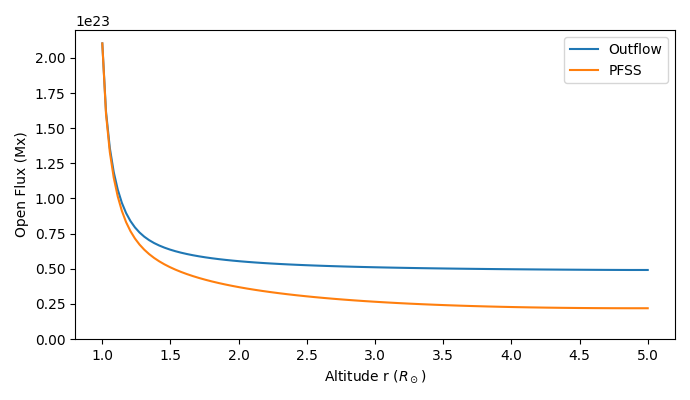
Open Flux Comparison
This example calculates PFSS and Outflow fields, and plots the Open Flux (OSF) as a function of height for both
import outflowpy

import numpy as np
import matplotlib.pyplot as plt
import astropy.constants as const
import matplotlib.patches as patches

#Specify model resolutions
ns = 90
nphi = 180
nrho = 60
rss = 5.0

#Download data for a specific date and time
obs_time = "2017-08-21T00:00:00"
hmi_map = outflowpy.obtain_data.prepare_hmi_mdi_time(obs_time, ns, nphi, smooth = 1.0*5e-2/nphi, use_cached = True)

#Set up Input files for PFSS and default outflow profile
pfss_in = outflowpy.Input(hmi_map, nrho, rss, mf_constant = 0.0)
outflow_in = outflowpy.Input(hmi_map, nrho, rss)

#Calculate the magnetic fields
pfss_out = outflowpy.outflow(pfss_in)
outflow_out = outflowpy.outflow(outflow_in)

#Define function for calculating open flux as a function of height
def find_oflux_profile(br):
    """
    Outputs the open flux profile (in Maxwells) as an array aligned with radial grid centres
    """
    rsun_cm = 6.957e10
    ofluxes = np.zeros(np.shape(br)[2])
    for i in range(np.shape(br)[2]):
        surface_area = 4*np.pi*(np.exp(outflow_in.grid.rg[i])*rsun_cm)**2
        ofluxes[i] = np.sum(np.abs(br)[:,:,i])*surface_area/(nphi*ns)
    return ofluxes

ofluxes_pfss = find_oflux_profile(pfss_out.br)
ofluxes_outflow = find_oflux_profile(outflow_out.br)


fig, ax = plt.subplots(1,1, figsize = (6.9, 4.0))

plt.plot(np.exp(outflow_in.grid.rg), ofluxes_outflow, linewidth = 1.5, label = "Outflow")
plt.plot(np.exp(pfss_in.grid.rg), ofluxes_pfss, linewidth = 1.5, label = "PFSS")

plt.ylim(ymin = 0)
plt.xlabel('Altitude r ($R_\odot$)')
plt.ylabel('Open Flux (Mx)')
plt.legend()
plt.tight_layout()

plt.tight_layout()
plt.show()
Expected output: